Real-time Monitoring & Plotting
- Real Time Plotting while monitoring ROP, Hotwire and Chromatograph Gases, CO2, MWD Gamma, MWD Resistivity and other data available from a WITS feed. (No spreadsheets, text or LAS files to import).
- Ability to read and plot gas real-time from gas instruments including SRI, Terra SLS, Baseline FID, Bloodhound, Series 2000, Rig Rooster, Pason Gas Detector, Analytical, Blue Ray, Mass Spec and any instrument sending data via WITS.
- Fully WITS Capable.
- Real-time Gas Chart and 24-hr Time-based WITS Chart.
- Program includes Lag Calculator and Alarms (including WITS alarms).
Comprehensive Reporting & Printing Capabilities
- Full Set of Reports including Morning, Show, DST, Bit Record, Down-time and End of Well Reports. View and print them directly from the log with just a click of the mouse. They can also be saved as PDF’s for e-mailing.
- Easy creation of LAS files including Version 3 which includes descriptions.
- Easily Save the Image as a BMP, JPEG, TIF, PDF, GIF or PNG file.
- Remote real time viewing. (using third party software Dropbox)
Vertical & Horizontal Logs in one Program
- One program for Vertical, directional (TVD Log) or Horizontal wells. (No modules)
- Easy entering and editing of all data at any time anywhere on any log without missing any incoming data.
- Instantly view 1, 2 or 5 in a Vertical or Horizontal format with a click of a mouse.
- Project Inclination on horizontal logs with the ability to insert dip factors.
- Easily add descriptions, surveys, and notes to horizontal log.
- The Zoom Feature enables you to view the entire well and go to any depth by clicking on that part of the log.
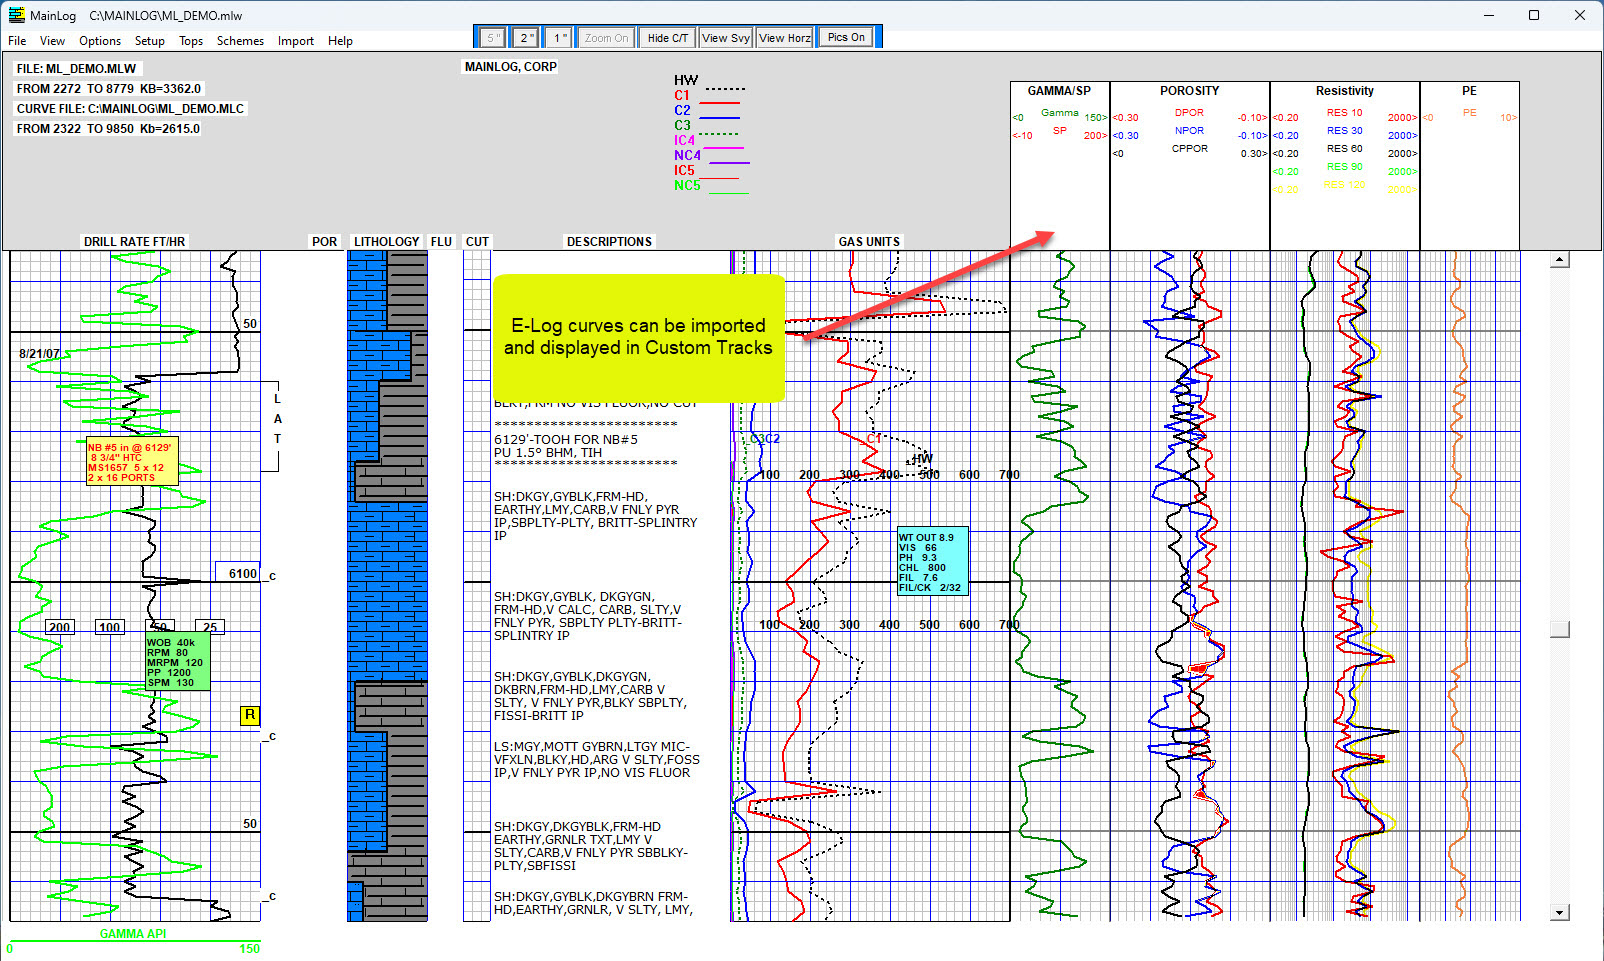
Importing of E-log Curves & Sample Photos
- Importing of E-log curves and offset curves for correlating. (ability to slide gamma curve up or down for correlating)
- Ability to set Mudlog formats.
- Import offset MainLog ROP curves for correlating.
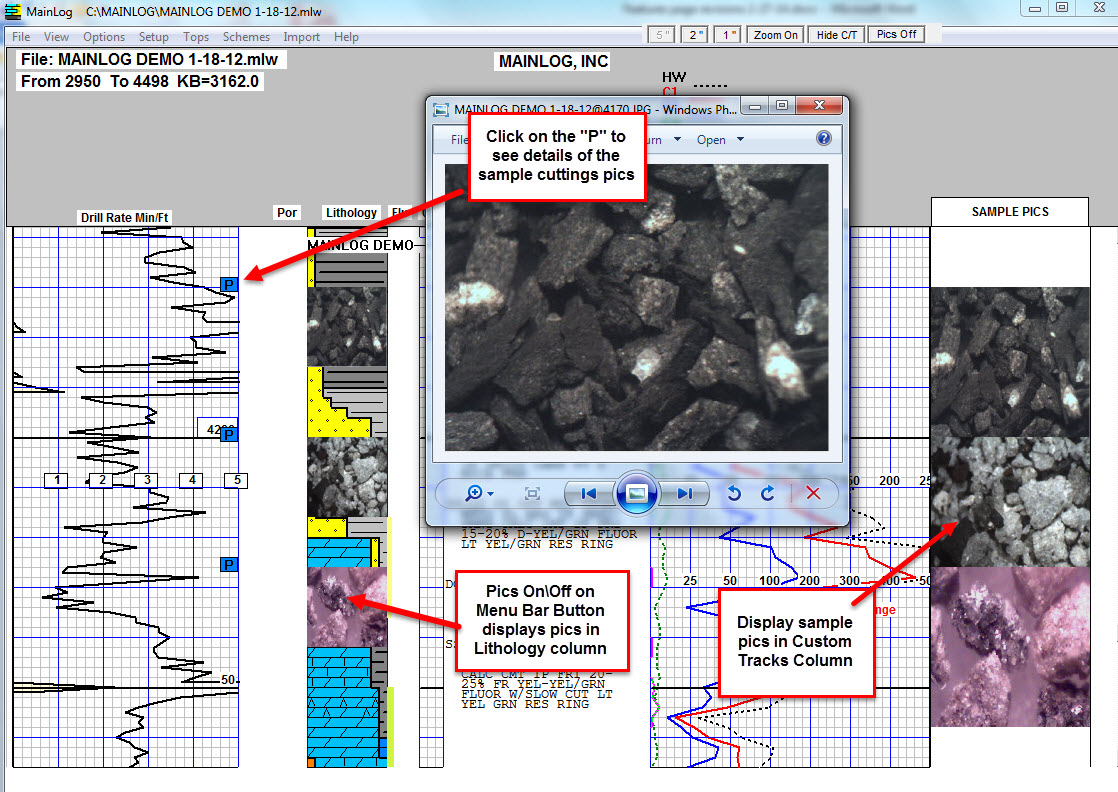
- Ability to import Cutting Photos and other images onto the mudlog.
- Ability to adjust file depth to match e-log depth at end of well.
Customization of the Log Format
- Logarithmic and multiple linear scales.
- Formatting of Curve Style and color.
- Add Custom Tracks for plotting curves from WITS feed. (i.e. WOB, Torque, CO2, RPM, PP, D-Exponent, XRF, e-log curves, wetness-balance ratio, etc.)
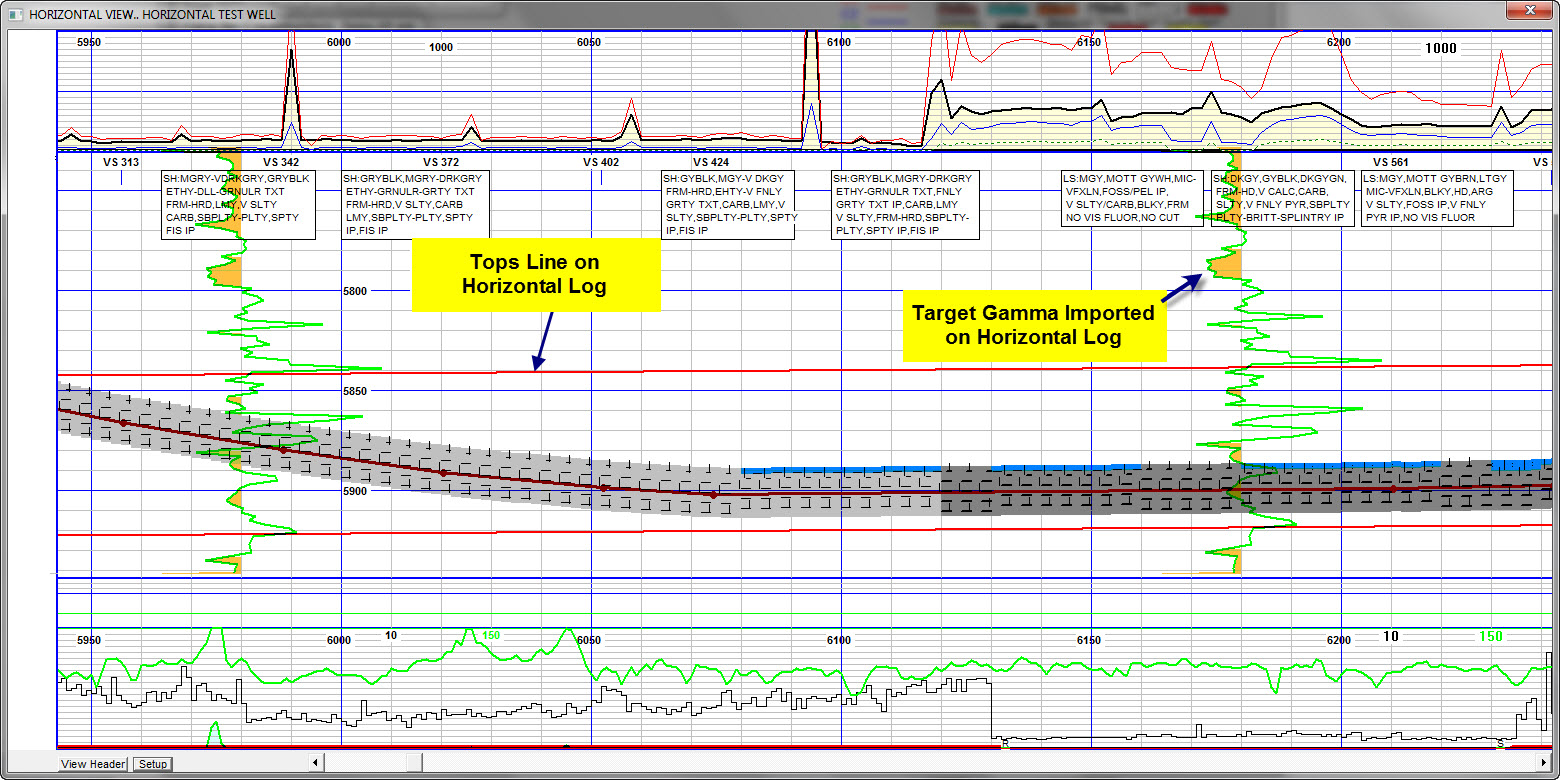
- Drawing of a Tops Line on both the vertical and horizontal log.
One-man / Un-manned Capabilities and other Features
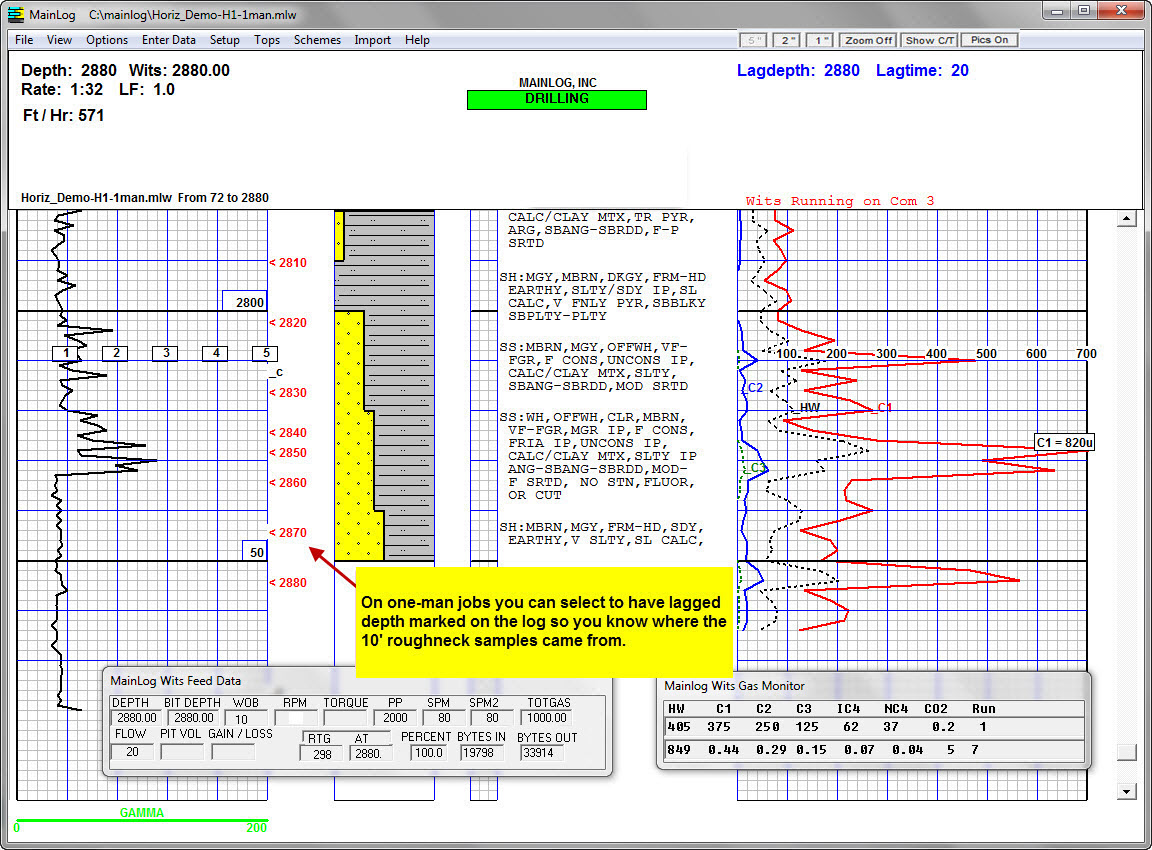
- Lagged Depth Marked on log to aid in one-man logging jobs.
- Automatic depth corrections made, with backups, when drillers make depth corrections on EDRs.
- Auto-drill mode when wits feed is down for getting depth.
Real-time Monitoring & Plotting
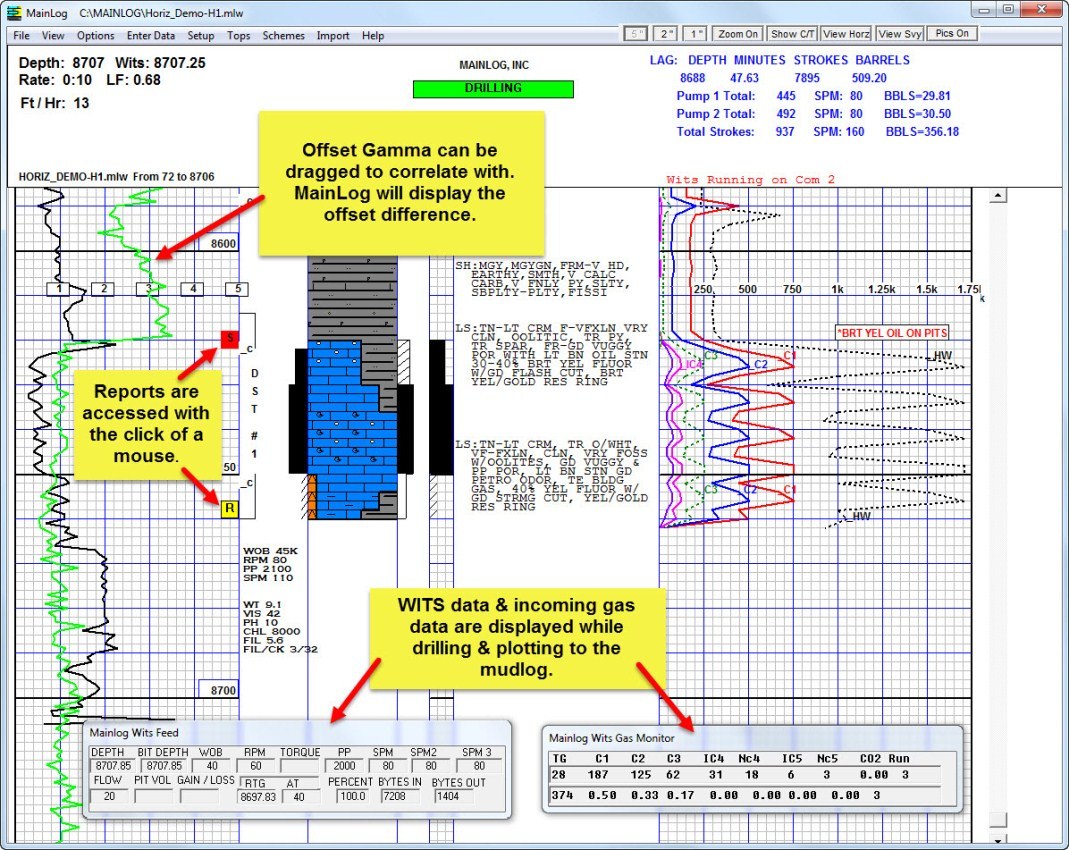
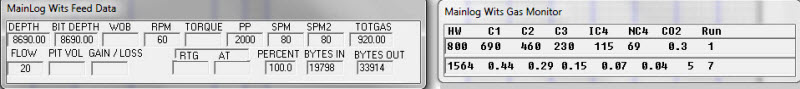
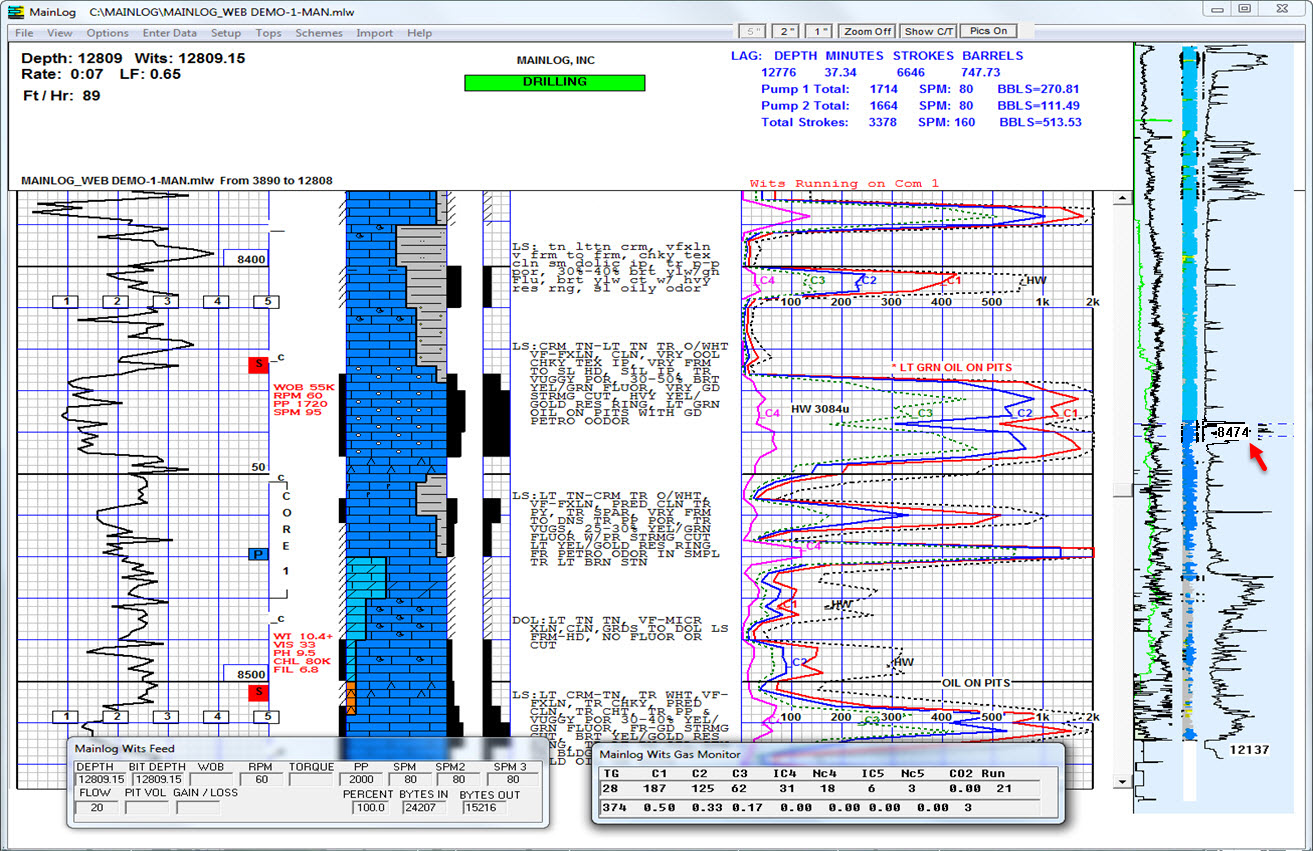
MainLog is truly a real time program in that it has the ability to read and even control some gas detection instruments and/ or read a “WITS” feed from them. It can also read and plot wits data being sent in from an EDR directly to the mudlog. Even MWD Gamma & Resistivity can be WITS in, in real time. You are actually looking at and working with a mudlog all the time, no importing of spreadsheets, text or LAS files to delay you in the log presentation. Entering in descriptions, notes, well information, as well as editing, is all done while incoming ROP, gases and WITS data are being plotted in real time.
Click to View Full Size Image
In the data acquisition mode, MainLog displays a WITS and Gas Monitor box showing the incoming data, including Real Time Gamma if available via WITS.
Gas Charts
MainLog can read directly from most gas detection instruments via a Modbus interface. In this mode a real time gas chart can be displayed showing chromatograms, the hot wire reading, depth marks, lagged depth and time. Annotations can also be made easily on the chart. It creates a 24-hour chart file that is saved and stored for review at any time, even after the well is done.
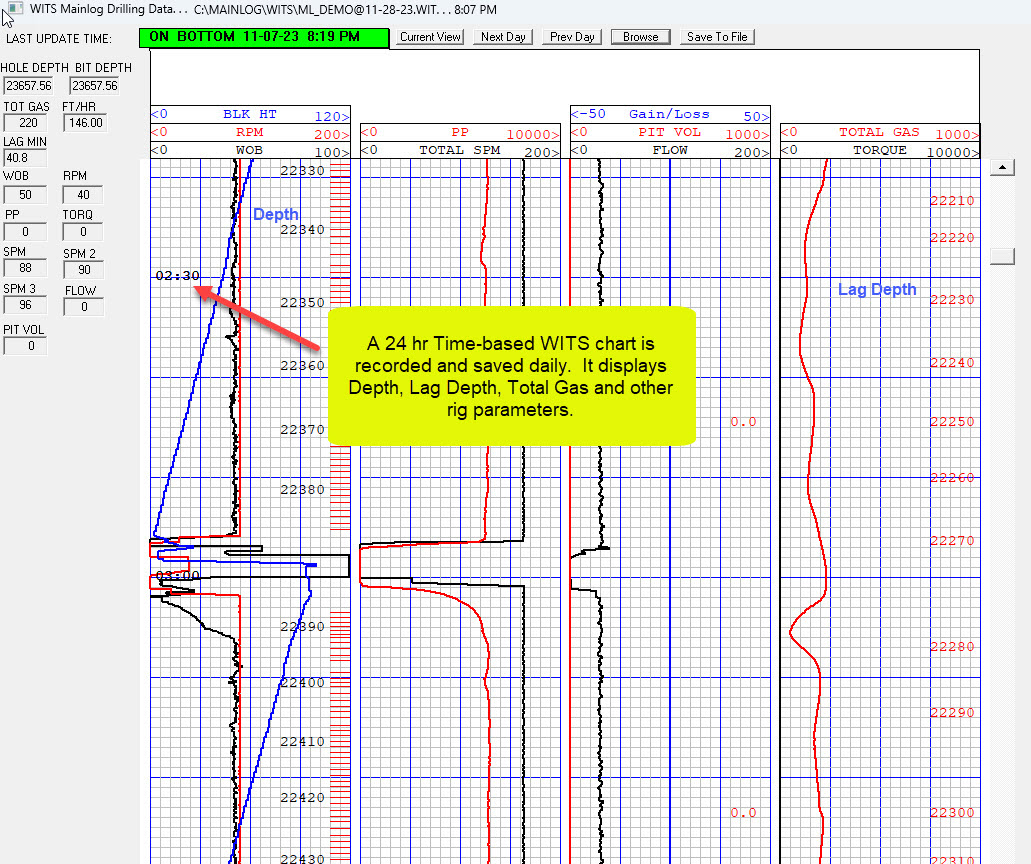
WITS Chart
MainLog creates and saves daily Time-based WITS chart. This 24 hr daily file records depth, lag depth, total gas, WOB, SPM, PP, Pit Vol, Gain/Loss and other rig data being WITS in. Previous days can be viewed at anytime without interfering with current data coming in.
Comprehensive Reporting & Printing Capabilities
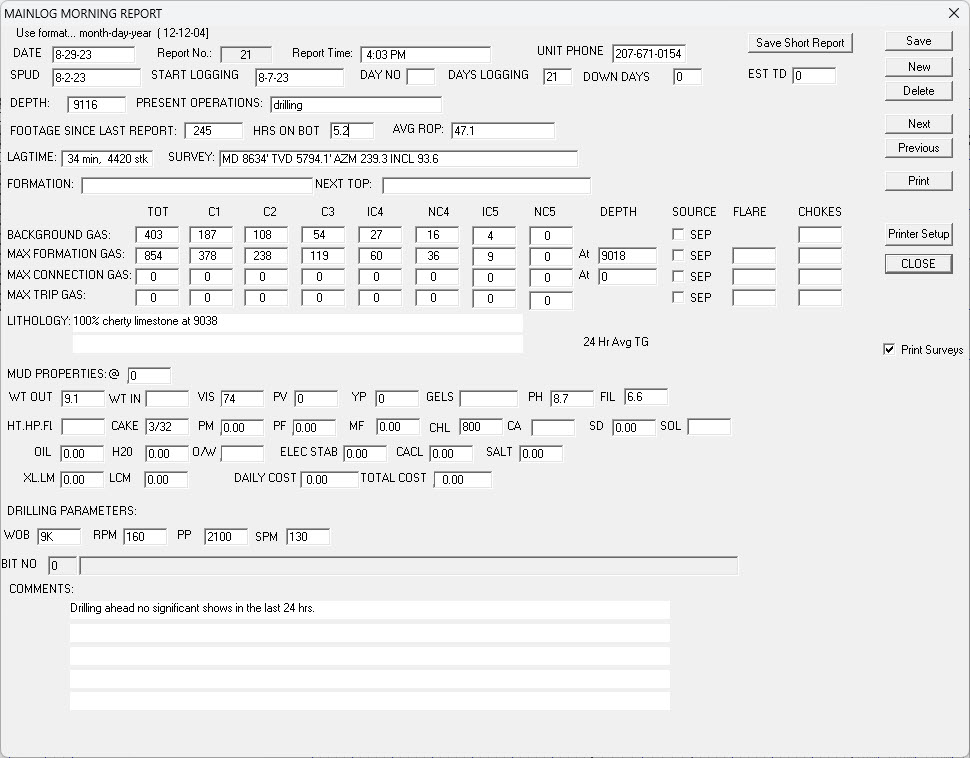
The ability to create and embed all Morning, Show, DST and Downtime reports in the mudlog. Makes it easy to access, view and print reports. When creating a new morning report MainLog will automatically calculate the following information and enter it into the report:
- Date & time
- Day & Report number
- Depth
- Footage made since last report
- Ft/hr
- Header information
- Current background gas
- Maximum gas since last report & any trip or connection gas
After being created the morning reports can be accessed by just clicking on the letter “R” in the ROP column; the letter “S” for Show Reports, the letter “D” for DSTs, “P” for jpegs of sample photos, DTR for Downtime Reports and “ISO” for Iso-tube Reports.
Morning Report
Show Report

DST Report
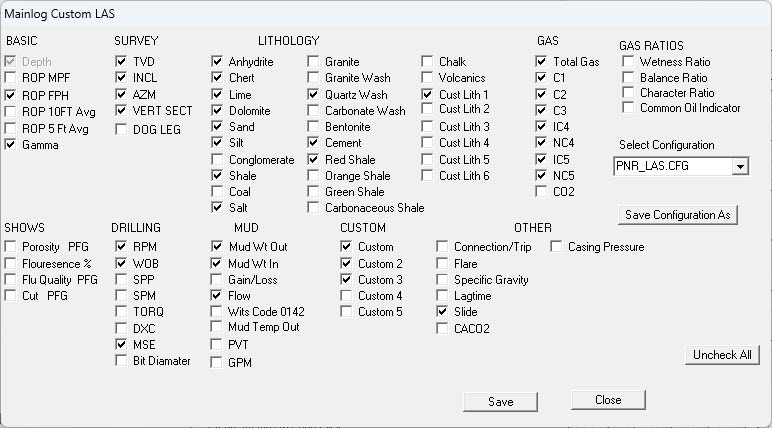
LAS Files
LAS Files can be easily created in the field or office version under the Options tab. LAS Version 3 is also available which includes descriptions in the LAS file. If needed the data included in the LAS file can be customized and the configuration saved for a specific client. There is also an option to automatically create and send an LAS file in with the mudlog.
Save Image
The logger and office user can create a TIF, BMP, JPG, PNG and GIF file of the mudlog or horizontal log. A PDF file can also be created with additional software, Adobe or freeware CutePDF.
Vertical & Horizontal Logs in one Program
With the “Quick View” menu the user can easily view a 5″, 2″ or 1″ vertical or horizontal log, turn on Custom Tracks, view surveys and turn samples pictures on.
5 Inch Vertical Log

Click to View Full Size Image
1 Inch Vertical Log

Click to View Full Size Image
Horizontal Logs
Horizontal Logs are easily created by either manually entering-in surveys or importing them into the working mudlog.
When entered in, MainLog will create the horizontal log and it can be viewed and printed in a 5″, 2″ or 1″ format. It can also be saved as a TIF, JPEG, BMP, PNG, GIF or PDF file.
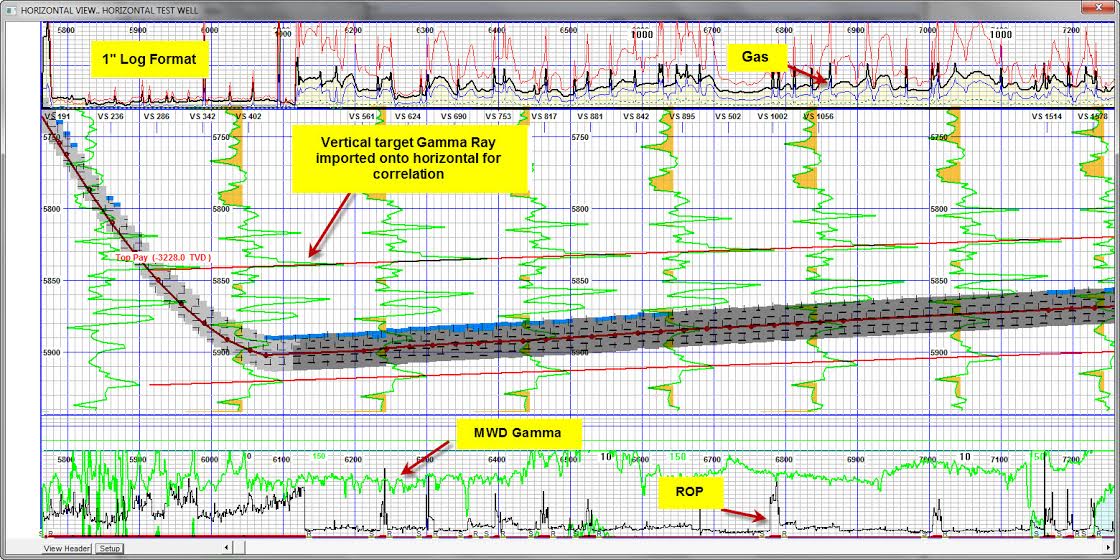
Click to View Full Image Size
The five Inch horizontal is easily drawn from the working mudlog with little or no additional logger input. Redundancies such as re-writing descriptions or surveys are not necessary to create the 5, 2 or 1 horizontal. Anchor and target e-log curves can be imported onto the horizontal log to help correlate while drilling.

Click to View Full Size Image
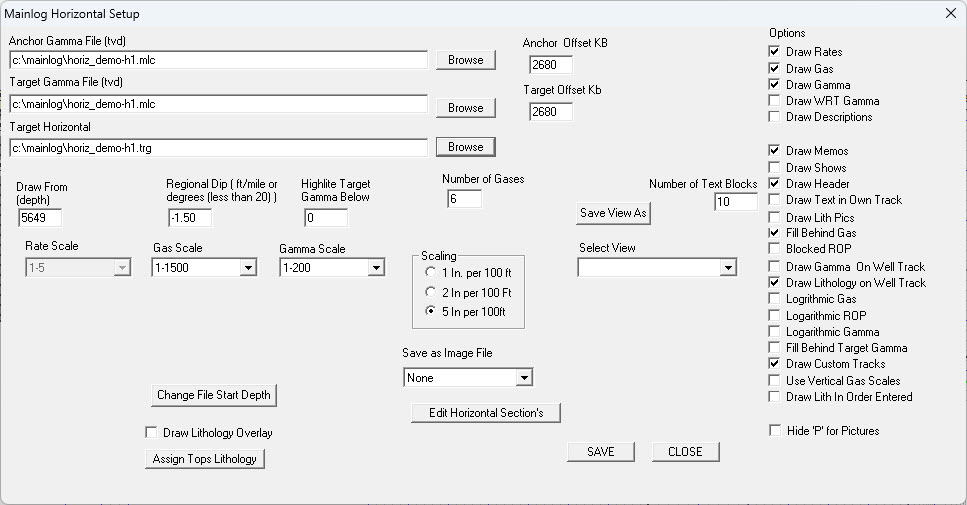
In the Horizontal Set-up Menu there are many options available including:
- Gas, ROP and Gamma Scale changes
- Logarithmic or linear gas scales
- Drawing depth from
- Figuring regional dip for target gammas
Importing of E-log Curves
Another feature of MainLog is the ability for the logger and office geologist to import E-logs curves and display them in custom tracks. Offset gamma ray curves can imported for correlating. They can be clicked and dragged up or down to determine how high or low you are to that well.
Cutting’s Photo
Integrating a jpeg photo of a sample cutting is as easy as naming the photo at the depth it was taken (i.e. 7020.jpeg) and copying it to the c:/MainLog directory. MainLog handles it from there and the client can easily open it once the log is e-mailed in by just clicking on the letter P in a blue box, from the mudlog.
Click to View Full Size Image
Customization of the Log Format
Log colors: The logger and office user has the ability to choose any color for any curve, descriptions or notes on the log.
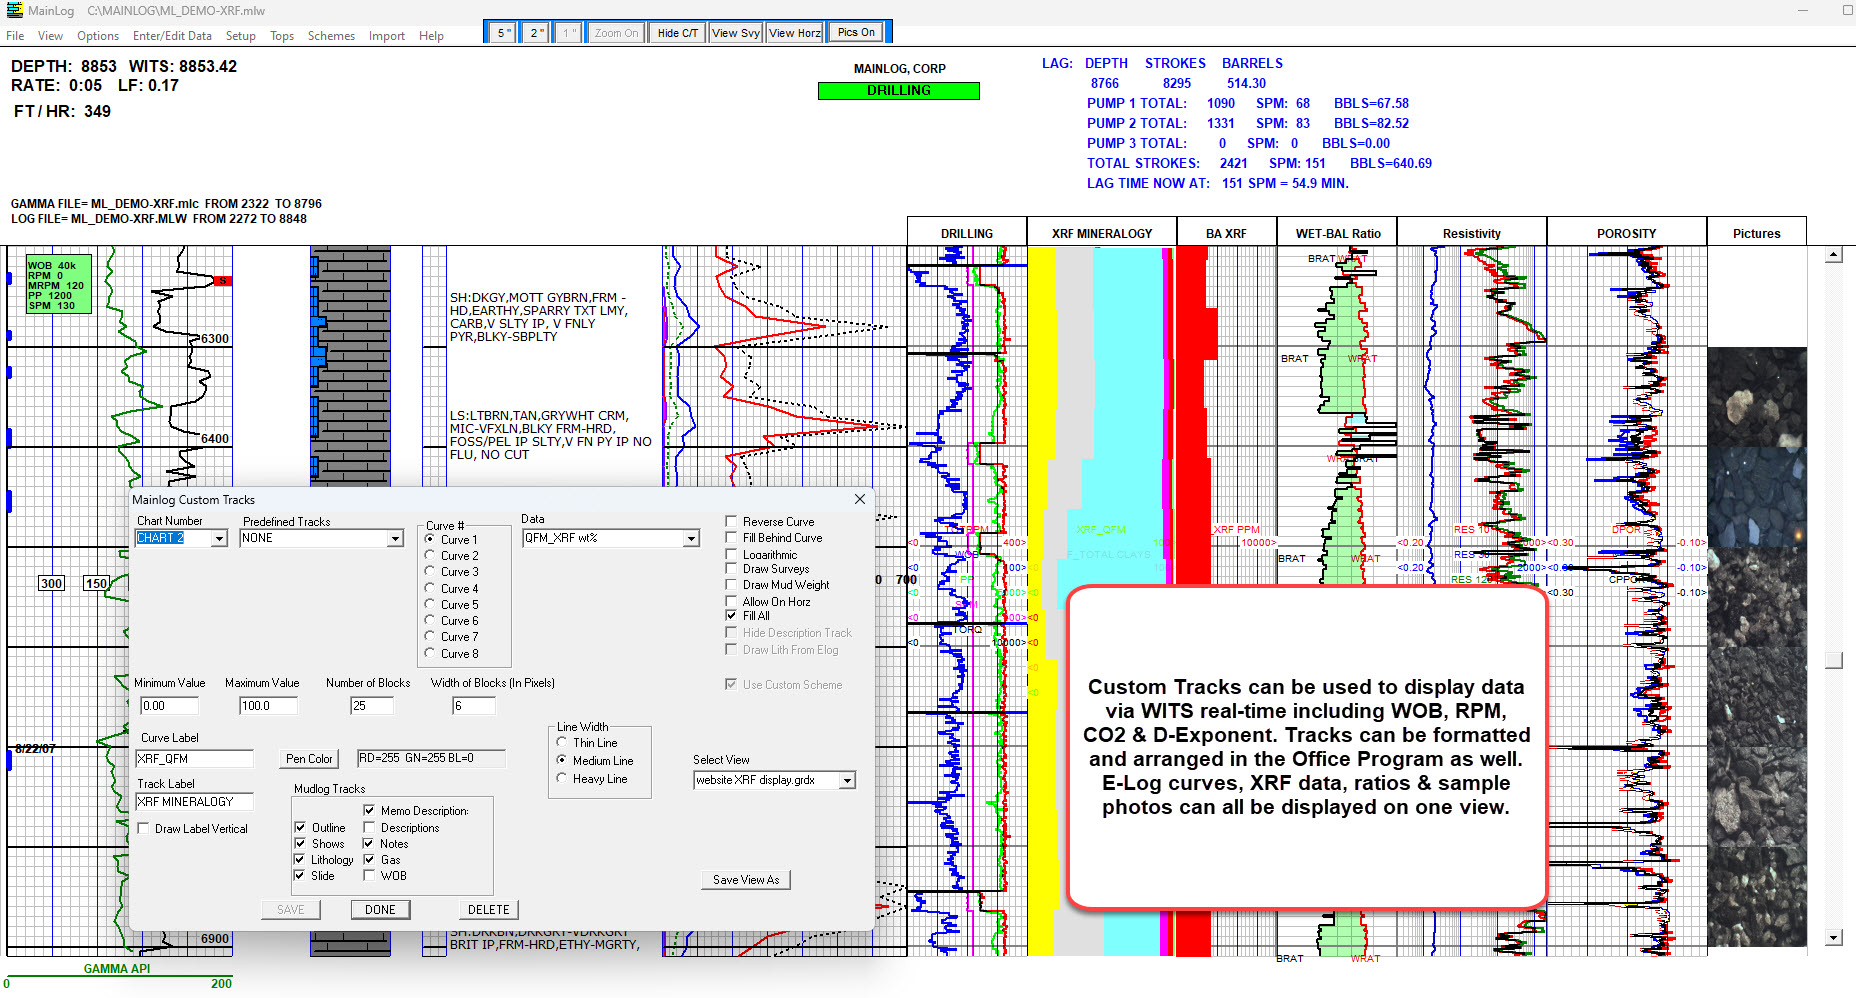
Custom Tracks
Fifteen additional custom tracks can be added to MainLog, with up to eight data curves on each track. These can include data being sent in via WITS from the rig such as, WOB, SPM, PP, RPM, Torque, etc. D-Exponent can also be plotted with the correct information being WITS in. E-log curves and XRF data can be imported and displayed. All types of gas ratios including Wetness Balance Ratio and Pixler can be shown.
Lag Calculator
A theoretical lag can be calculated by entering the specific drilling parameters. With a wits feed from the EDR, lag can be calculated using strokes. Even down hole motors can be figured in.
Alarms
Alarms can be set by depth, time, high or low gas, drilling breaks, long feet and even when to catch a sample. A wits alarm can also be set up as shown below.
Project Inclination
To aid in correlating on a horizontal well, projections can be made by clicking and dragging on the last survey point on the 5 horizontal log. MainLog will show the TVD at the measured depth the point was dragged to, and give the inclination to get there. The example also shows an imported Target gamma to aid in correlating.

Click to View Full Size Image
One-man / Un-manned Capabilities and other Features
On one-man jobs, Mainlog can mark the lag depth on the log to aid the logger with rough neck caught samples.
Click to View Full Size Image
Tops Lines
Tops lines can easily be drawn onto vertical and horizontal logs. Once drawn you can click and drag on the tops Line and subsea will be recalculated. When created the Top becomes part of the Tops Menu and by selecting it will take you to that point on the log.

Click to View Full Size Image
Click to View Full Size Image
Zoom
Using the Zoom feature shows the entire well on the right side of the screen. Click on any part of the well and it will take you there on the 5-inch log.
Click to View Full Size Image